
Descriptions
Mastering Prometheus and Grafana (Including Loki & Alloy), Prometheus is a free, powerful time-series database that monitors microservices and infrastructure (e.g., Kubernetes). Its flexible query language, PromQL, lets you record real-time metrics and generate valuable insights. This course is tailored for developers, DevOps Engineers, and Solution Architects who want to learn Prometheus and Grafana’s observability stack and apply it to their work. You’ll learn how to set up and configure Prometheus, Grafana, and Grafana Loki on Linux, Windows, and Mac, as well as with Docker. This powerful stack will enable you to collect metrics and logs and visualise them with professional-looking dashboards in Grafana. Prometheus is thoroughly explored in this course and covers Functions, Alerting, Recording Rules, Short-lived Jobs, Push Gateway, and Security. Grafana is also adequately covered with lectures that teach you how to install Grafana, create dashboards, create alerting rules, notify management, and administer Grafana. Metrics are not the only signal that matters in the realm of observability. Logs play a crucial role in identifying and, more importantly, diagnosing the root cause of the problems. That is why the course has a section specifically for Grafana Loki, Grafana Lab’s log collection and analysis tool.
What you’ll learn
- Installing Prometheus on Windows, Linux, and Mac
- Pushing Metrics to Prometheus
- Visualizing Metrics in Prometheus
- Functions and Aggregation Operators in Prometheus
- Alerting in Prometheus
- Defining Data Collection Rules for Faster Data Aggregation
- Securing Prometheus with HTTPS and Authenticaiton
- Installing Grafana on Windows, Linux, and Mac
- Using Grafana to Visualize Prometheus Metrics
- Securing Grafana with OAuth and Active Directory
- Grafana Loki (Installationa & Use) to Collect and Analyse Logs
Who this course is for
- DevOps Engineers
- Developers
- Solution Architects
Specificatoin of Mastering Prometheus and Grafana (Including Loki & Alloy)
- Publisher : Udemy
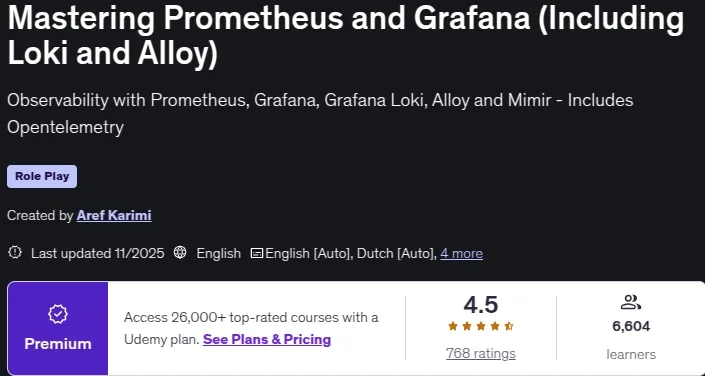
- Teacher : Aref Karimi
- Language: English
- Level : All Levels
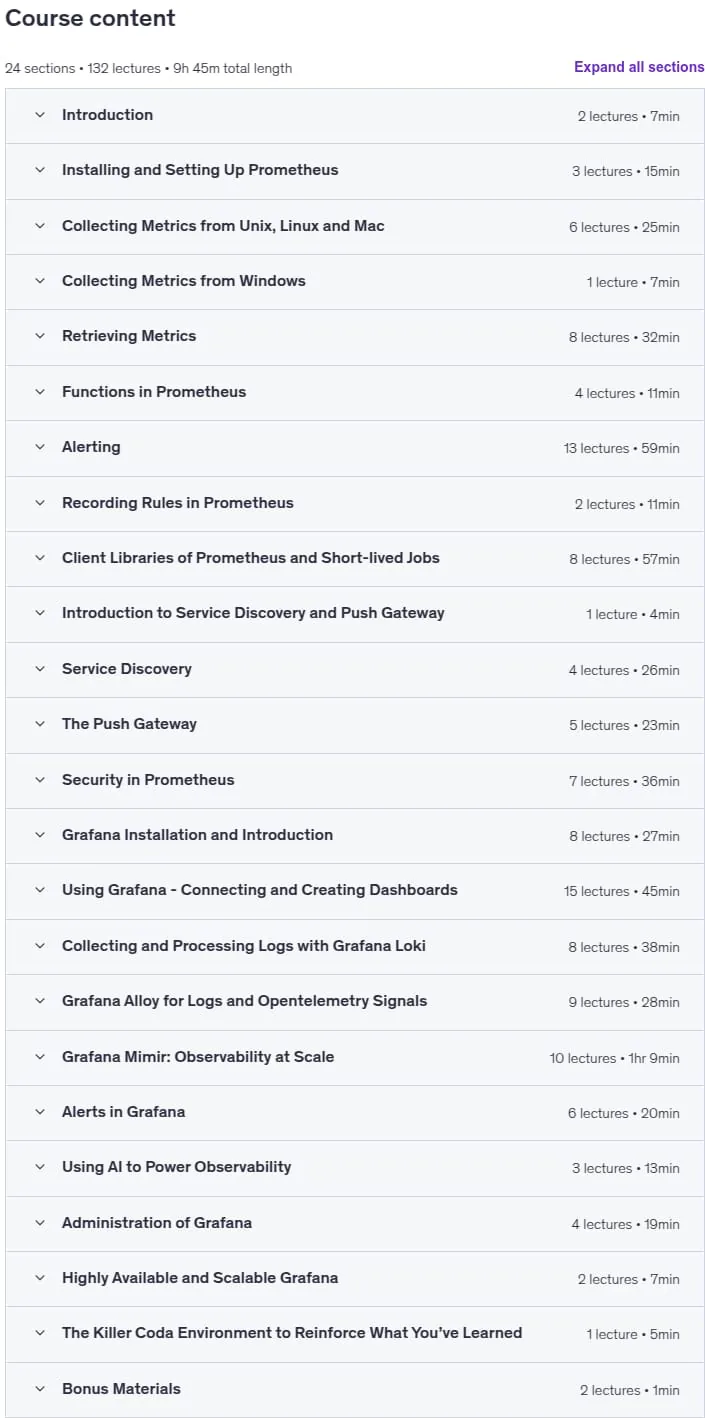
- Lectures : 132
- Duration : 9 hours and 45 minutes
Content of Mastering Prometheus and Grafana (Including Loki & Alloy)

Requirements
- Basic knowledge about IP, DNS and general networking concepts
Pictures

Sample Clip
Installation Guide
Extract the files and watch with your favorite player
Subtitle : English
Quality: 720
The 2025/11 version has increased the number of lessons by 15 and the duration increased by 1 hours 35 minutes compared to 2025/3.
Download Links
Downloadly
Rapidgator
Password file(s): www.downloadly.ir
File size
2.78 GB