
Description
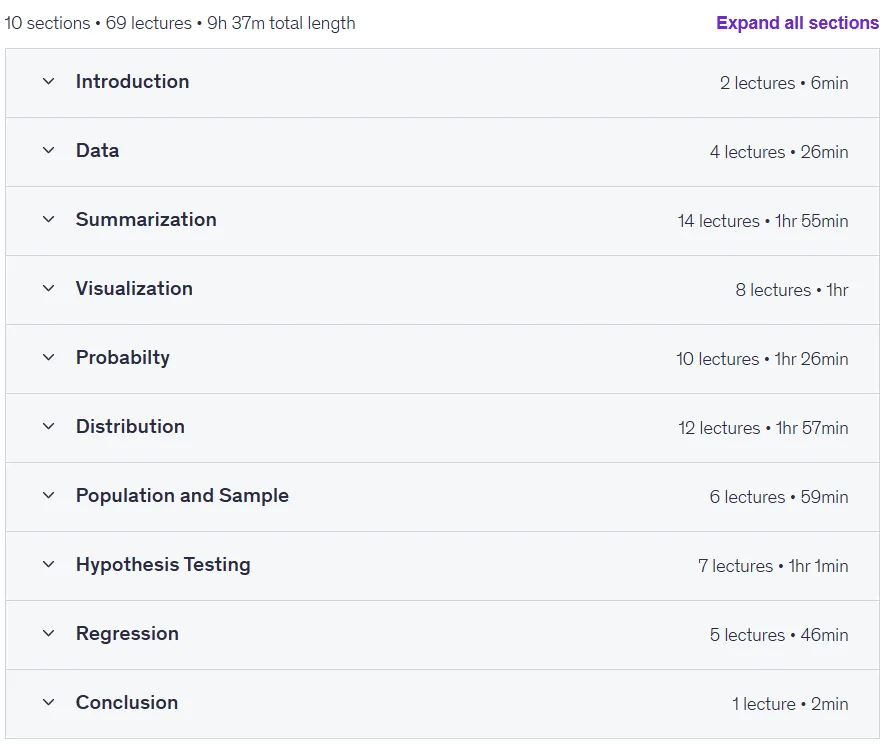
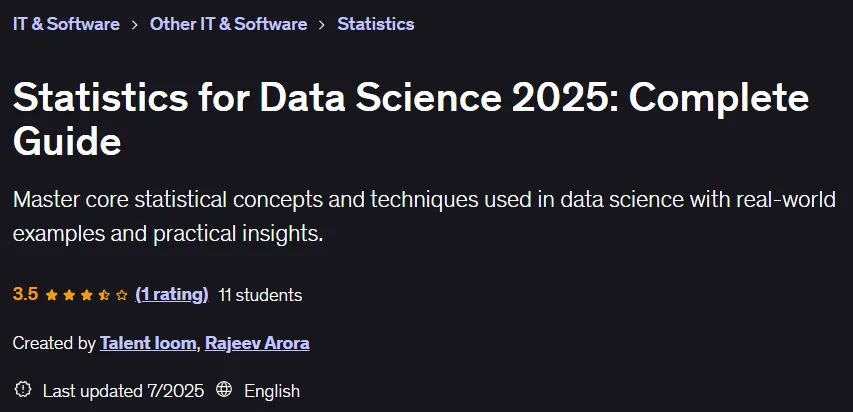
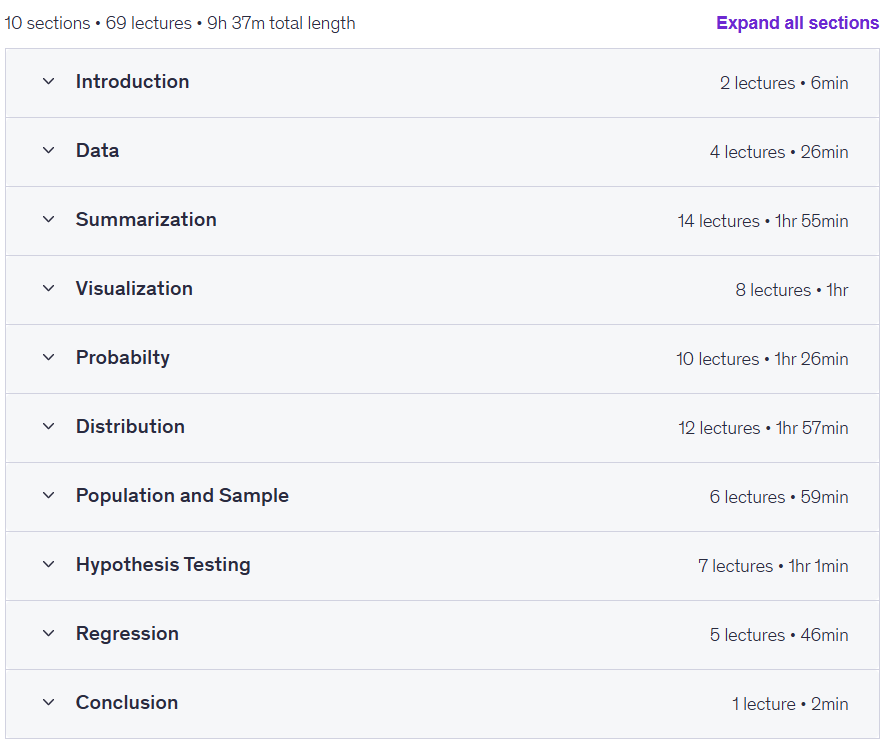
Statistics for Data Science 2025: Complete Guide. This course provides a complete learning path to mastering essential statistical concepts in data science and data analysis. Designed for beginners with no mathematical background, this course starts with the basics. You’ll understand the fundamentals of statistics, including variables, data types, and measurement scales, and learn how to prepare raw data for analysis. The course emphasizes using tools like Python and Excel to summarize data with techniques like central tendency and dispersion, as well as creating professional visualizations like histograms and scatter plots. More advanced concepts like probability, Bayes’ theorem, and various distributions like normal and binomial are covered with real-world examples. You’ll learn sampling principles, the central limit theorem, and sampling distributions for accurate inference. This course covers constructing and interpreting confidence intervals, performing hypothesis testing for various business scenarios, and understanding type I and type II errors. In addition, you will explore relationship analysis through correlation and regression, including linear and multiple regression, and learn how to assess model quality. Led by experienced instructor Rajiv Arora, this course combines theory, hands-on exercises, and applied projects to provide a solid foundation in statistics for success in data science, business analytics, and research.
What you will learn
- Understands basic statistical concepts including variables, data types, and measurement scales for accurate data analysis.
- Master data summarization techniques such as central tendency, dispersion, and frequency distribution for meaningful interpretation of data.
- Analyzes data using visual tools such as histograms, box plots, scatter plots, and pie charts for clear and effective insights.
- It applies the laws of probability, conditional probability, and Bayes’ Theorem to make predictions and decisions based on data.
- Learn the basics of distributions, including binomial, normal, Poisson, and t distributions, for modeling real-world data.
- Distinguishes between the population and the sample and employs sampling techniques to reliably collect representative data sets.
- Understands and applies the Central Limit Theorem and sampling distributions to make accurate inferences from sample data.
- Constructs and interprets confidence intervals and performs hypothesis testing with real business and research scenarios.
- It identifies and avoids Type I and Type II errors while performing one-sided and two-tailed significance tests.
- Examines the power of correlation and regression analysis to understand relationships and predict future trends.
- Performs Multiple Regression Analysis and evaluates the model’s fit using least squares and error minimization.
- It builds a strong foundation in statistics, which is essential for data science, business analytics, research, and academic excellence.
This course is suitable for people who:
- Academic students and researchers who need additional support in statistics for academic success and exam preparation, or who need to apply statistical methods in their courses, theses, or research projects.
- Business professionals and managers looking to make data-driven decisions using statistical tools and insights.
- Aspiring data scientists and data analysts who need a strong foundation in statistics before moving into machine learning or advanced analytics.
- Marketing professionals and product teams who want to interpret customer data, conduct A/B tests, and optimize campaigns with confidence.
- Finance, economics, and accounting professionals who work with quantitative data and need to hone their analytical skills.
- Project managers and consultants who need to assess trends, measure performance, and support strategic decisions with data.
- People changing their career paths and beginners who have no previous experience in statistics but are eager to upgrade their skills for data and technology-related roles.
- Teachers and educators looking to update their knowledge or improve how they teach statistical thinking in the classroom.
- Technical professionals (developers, engineers) who want to better understand data behavior, performance metrics, and test results.
- Anyone who is curious to know how statistics works and how to apply it to solve real-world problems in work, education, or everyday life.
Course details
- Publisher: Udemy
- Instructor: Talent loom , Rajeev Arora
- Training level: Beginner to advanced
- Training duration: 9 hours and 37 minutes
- Number of lessons: 69
Course headings
Prerequisites for Statistics for Data Science 2025: Complete Guide
- No prior knowledge of statistics or mathematics is required—this course is designed for absolute beginners.
- A basic understanding of high school-level math is helpful but not mandatory.
Course images

Sample course video
Installation Guide
After Extract, view with your favorite player.
Subtitles: None
Quality: 720p
Download link
Downloadly
Rapidgator link
File(s) password: www.downloadly.ir
File size
10.4 GB