
Description
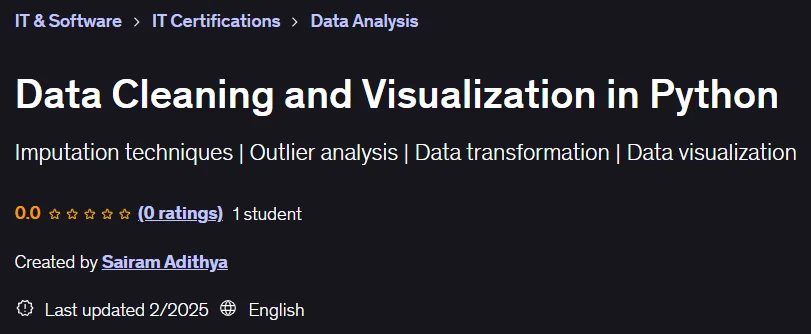
Data Cleaning and Visualization in Python. This course provides a comprehensive understanding of exploratory data analysis, or EDA, which is a critical step in the machine learning cycle. Its main goal is to identify problems in a dataset and apply appropriate techniques to improve data quality. The first part of the course focuses on data cleaning and covers essential techniques such as missing value management, data transformation, and outlier detection. This part teaches various methods for filling in missing values, including statistical, neighbor-based, and predictive methods, along with transformations such as logarithmic, square root, and Box-Cox. It also covers outlier detection techniques such as Z-score, interquartile range, and Mahalanobis distance. The second part is dedicated to data visualization and covers univariate, bivariate, and multivariate analyses. This section discusses the types of graphs including histograms, box plots, scatter plots, and heat maps to make data interpretation clear. The course concludes with real-world case studies that demonstrate how exploratory data analysis helps extract meaningful insights. All implementations are done in Python using libraries such as Pandas, NumPy, Seaborn, and Matplotlib. By the end of this course, participants will have the practical skills to effectively perform exploratory data analysis on any dataset and use these techniques to improve data and achieve better results in machine learning analyses.
What you will learn
- Understanding real data issues:
- Understand the different issues that can exist in real-time data.
- Data cleansing techniques:
- Understand techniques for filling in missing values (Imputation) and analyzing outlier data (Outlier Analysis).
- Understanding data skewness and data transformation techniques to correct it.
- Visualization techniques:
- Understand techniques for visualizing features in univariate, bivariate, and multivariate formats.
- Practical implementation:
- Implementing the mentioned concepts on real datasets using Python language.
This course is suitable for people who:
- Beginner engineering enthusiasts who want to learn Data Science, Machine Learning, and Deep Learning.
- People who want to understand and apply the fundamental steps that can increase the performance of machine learning models.
- Engineering students from various backgrounds who can apply these concepts to their field of work.
- Artificial Intelligence (AI) and data science enthusiasts looking for a comprehensive course on data cleaning, analysis, and visualization using Python.
Course details
- Publisher: Udemy
- Instructor: Sairam Adithya
- Training level: Beginner to advanced
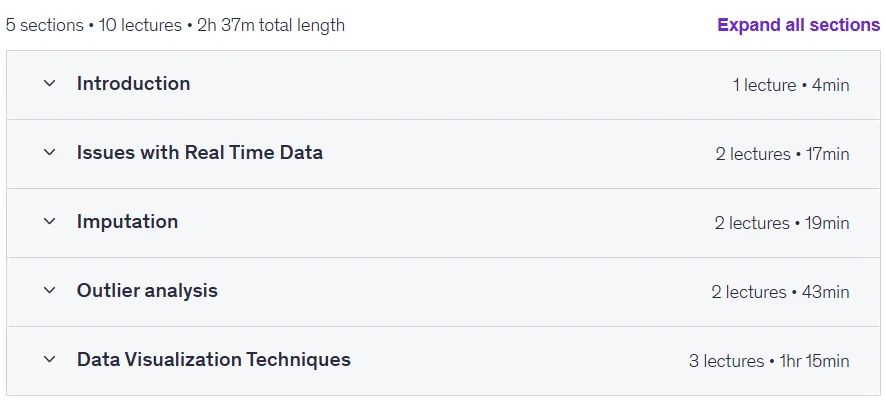
- Training duration: 2 hours and 37 minutes
- Number of lessons: 10
Course topics

Prerequisites for the Data Cleaning and Visualization in Python course
- This course is for beginners who do not have much expertise in data cleaning and analytics.
- Minimum level of expertise would be needed. Basic idea of python programming like variables, loops, conditional statements would be enough to understand the course.
- It is important to understand the theoretical aspects of the concepts. That’s the reason why this course is aligned more towards theory!!
Course images

Sample course video
Installation Guide
After Extract, view with your favorite player.
Subtitles: None
Quality: 720p
Download link
Downloadly
Rapidgator link
File(s) password: www.downloadly.ira
File size
2.2 GB