
Descriptions
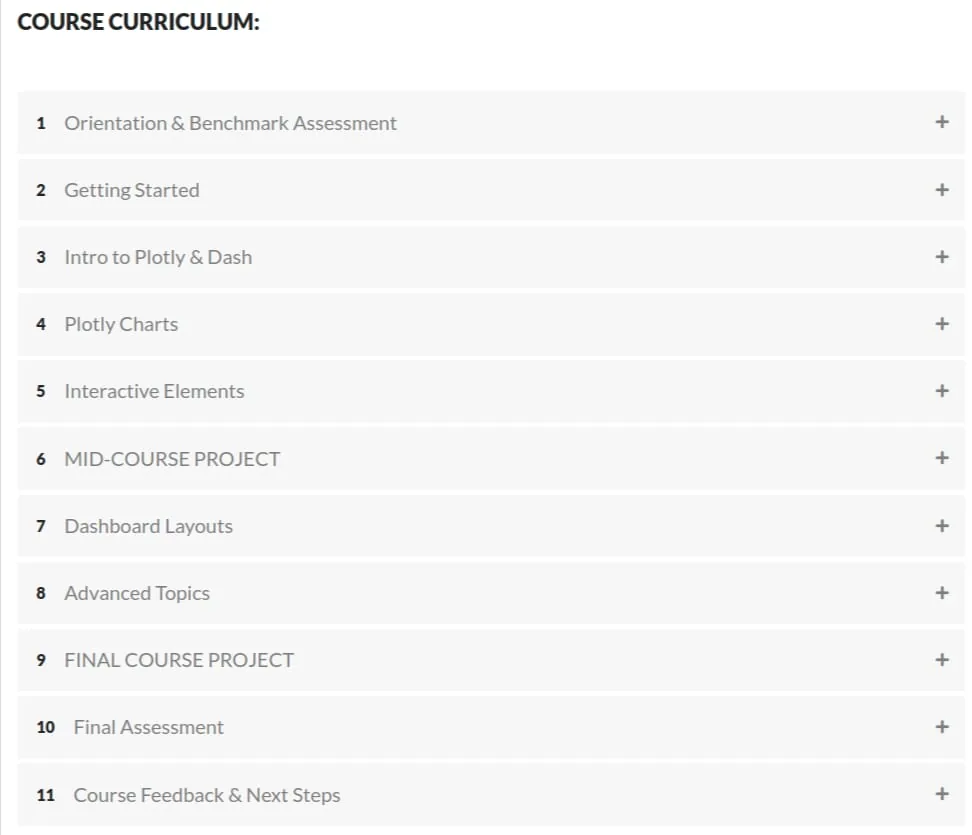
Interactive Dashboards with Plotly & Dash, This hands-on, project-based course teaches you how to create interactive visuals, dashboards, and web applications using Python’s Plotly and Dash libraries. You’ll learn core Dash application components and both front-end and back-end elements, build a variety of Plotly charts (line charts, scatterplots, histograms, maps), apply formatting and annotations, and add interactive controls such as dropdowns, checklists, sliders, and date pickers. The course also covers building and styling dashboards with markdown, HTML components, themes, grids and tabs, plus advanced topics including data tables, conditional and chained callbacks, cross-filtering, and deployment options.
Throughout the course you’ll complete hands‑on exercises and projects—playing the role of a Data Analyst for Maveluxe Travel—to practice end-to-end workflows from data visualization to dashboard deployment. Course materials include 8.5 hours on-demand video (14 CPE credits), 15 homework assignments (plus 2 course projects), 5 quizzes, and 2 skills assessments to help you apply Plotly and Dash to real-world analytics and BI scenarios.
What you’ll learn
- Understand core Dash components and application structure
- Create Plotly visualizations (line charts, scatterplots, histograms, maps) and apply formatting and annotations
- Add interactivity with controls (dropdowns, checklists, sliders, date pickers) and implement callbacks
- Build, style, and layout web-based dashboards using HTML/Markdown, themes, grids, tabs, and data tables
- Apply advanced patterns such as conditional and chained callbacks, cross-filtering, and deployment options
- Complete hands-on projects and assessments to apply Plotly & Dash to real-world analytics workflows
Who this course is for
- Data scientists, data analysts, and BI professionals who want to build interactive dashboards with Python
- Python developers seeking to add Plotly & Dash skills for web-based visualizations
- Anyone interested in learning end-to-end dashboard design, interactivity, and deployment for analytics
Specificatoin of Interactive Dashboards with Plotly & Dash
- Publisher : Maven Analytics
- Teacher : Chris Bruehl
- Language : English
- Level : All Levels
- Duration : 14 hours and 0 minutes
Content of Interactive Dashboards with Plotly & Dash

Requirements
- Jupyter Notebooks (free download, we’ll walk through the install)
- Familiarity with base Python and Pandas is recommended, but not required
Pictures
Sample Clip
Installation Guide
Extract the files and watch with your favorite player
Subtitle : English
Quality: 1080p
Download Links
Downloadly
Rapidgator
Password file(s): www.downloadly.ir
File size
1.44 GB